Ventura County Transportation Model
VCTM is Ventura County’s countywide weekday travel demand model. It helps VCTC and local agencies understand today’s travel patterns and evaluate how future land use, transportation projects, and policy decisions could affect roadway traffic, transit use, and vehicle travel across the county.
This page is designed to promote implementation of the Ventura County Transportation Commission’s adopted Strategic Plan Goal A5: “Leverage Data to Better Inform Transportation-Land Use Decision Making and Grant Seeking.” Navigate to the built-in web maps and VMT dashboard to explore data from the base year and forecast year model scenarios. For further assistance accessing model data please contact VCTC Planning staff: Andrew Kent – akent@goventura.org.
Overview
VCTM has been updated to a 2025 base year and a 2050 baseline forecast, reflecting updated land use, transportation networks, and travel assumptions developed with Ventura County jurisdictions and consistent with the broader Southern California regional modeling framework.
It uses a standard travel demand framework — trip generation, trip distribution, mode choice, and traffic assignment — to estimate travel behavior under different conditions. The model supports transportation impact analysis, long-range planning, Vehicle Miles Traveled (VMT) analysis under SB 743, and air quality and greenhouse gas (GHG) analysis.
Model Update: 2025–2050
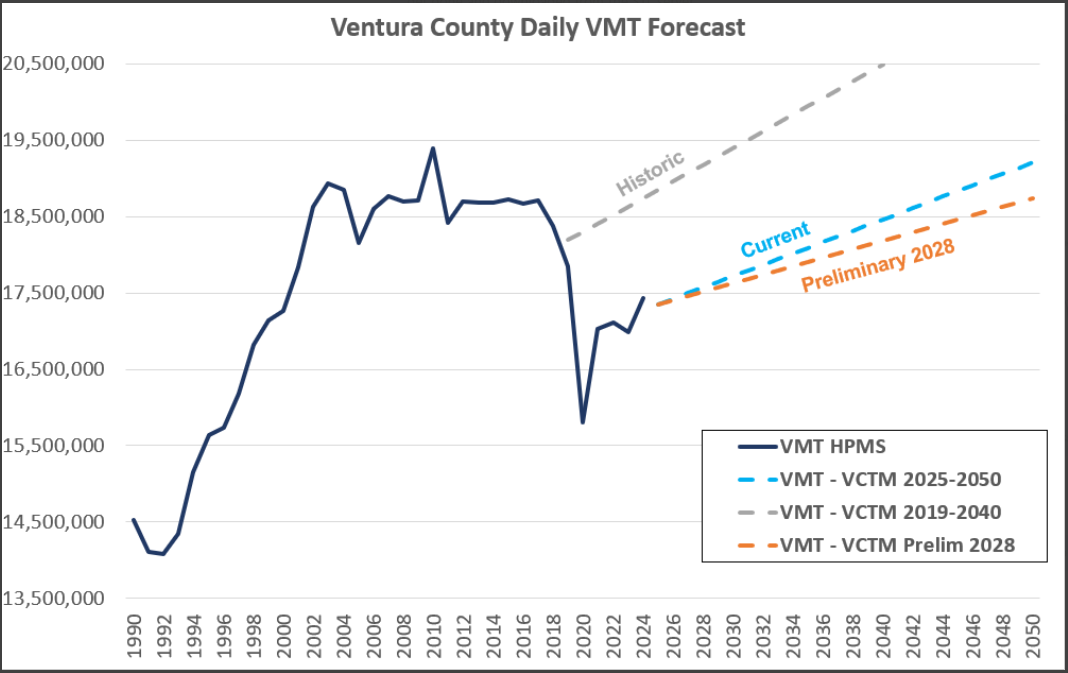
The current VCTM is a major update from the prior version. The earlier public model referenced a 2016 base year and 2040 forecast; the updated model now uses a 2025 base year and 2050 baseline forecast, with revised land use assumptions, refined transportation networks, and updated validation against observed traffic counts.
The 2025 validation meets accepted industry guidance, with strong agreement to observed counts across screenlines and facility types; meeting and exceeding all State and federal guidelines and validation thresholds.
Update presentation
Model Output Maps
Explore VCTM outputs in these interactive maps. Choose a map below, or open it full screen in a new tab.
VMT Dashboard
The SB 743 VMT Dashboard summarizes home-based and work-based VMT metrics and jurisdiction-level results from the VCTM — useful for CEQA transportation analysis.
SB 743 VMT model output for each scenario, the same data behind the dashboard. These are macro-enabled Excel workbooks.
Obtain a Copy of the Model
To request model data, technical assistance, or additional baseline outputs, contact VCTC Planning staff. To obtain a full copy of the model for scenario testing, return the applicable request forms to VCTC Planning staff.
VCTC Planning staff
Andrew Kent — akent@goventura.org
Model Development & Validation Documentation
Review the model documentation to understand its structure, assumptions, capabilities, and limitations. The updated technical documentation covers model development, calibration, validation, forecast assumptions, and air quality and SB 743 appendices.
- Model Development and Validation Report (2025 base year, 2050 forecast year)
- VCTM User’s Guide — setup, scenario management, outputs, utilities, and reporting
As with all travel demand models, the VCTM is an estimating tool that should be used together with professional judgment and project-specific review. For local project review, coordinate with the applicable city, county, or agency to confirm thresholds, methodologies, and local requirements.